top of page

Buildings Health Tracker
A standard building became a healthy one.
We designed digital experiences that improve the health of a building, from cleaner air to frictionless access that inspires trust.
A solution that provides a holistic view of the building health including occupant flow, wellness, and density, monitors and supports social distancing helps to improve air quality to mitigate bacteria and virus spread effectively, and provides real-time updates on spatial sanitation.
My Role
Interaction Design, Visual Design, Testing
Tools
Figma
Miro
Paper Prototypes
Usertesting.com
Usability Metric
Duration
20 Weeks

BACKGROUND
50 Percent
One-fourth of businesses witnessed a
drop in sales across the world.
From the world bank
-
On average sales drop by 27%
-
34% of firms have increased the use of the internet, social media, and digital platform.
-
17% of companies invested in the new equipment software or digital solutions.
THE PROBLEM
Companies dealing with the impact of the pandemic want to resume business operations while assuring the employees, guests, and partners that their facilities are safe and healthy
The customers want to minimize further downtime and mitigate future concerns.
OPPORTUNITY
What if we could use the right technology to help our customers to keep the indoors healthy and make the occupants feel safe?

Studies show that a healthy building has many benefits to organizations such as improved productivity, attracting talent, and better occupant health.
SOLUTION
BUILDINGS HEALTH TRACKER
A solution that provides a holistic view of the building health including occupant flow, wellness, and density, monitors and supports social distancing helps to improve air quality to mitigate bacteria and virus spread effectively, and provides real-time updates on spatial sanitation.

Buildings Health Tracker
Dashboard for Facility and Portfolio Managers to track the health of the building and get the issues fixed fast


Mobile App
Buildings performance KPIs anywhere/anytime through mobility


Digital Signage
Stay up to date with the measures taken by your company to keep you safe
PERSONAS & OUTPUT
How BUILDINGS HEALTH TRACKER works
As of today there is no provision for facility and portfolio managers to track the health of the building for occupants who are returning back to work after the pandemic.


DESIGN

PART ONE
Site Performance Overview
Set health KPIs to manage safety, security, and air quality to measure compliance to new regulations.
-
Overall Performance score of the site.
-
Pillar Scores and respective trends.
-
Automatic service ticket raise and resolution.
-
Alerts notification
Site Performance Overview
Indoor Air Quality
Set health KPIs to manage safety, security, and air quality to measure compliance to new regulations.
People counting
Thermal Screening
Occupant Density
Mask Compliance


PART TWO
Sensor Performance, predictive and Preventive Maintenance
-
Sensor Performance and details.
-
Highlight Issues for which tickets are raised.
-
Helps the FM/PM to make better decisions in planning Maintenance and finance.
-
Troubleshoot issues faster.
-
Introduction to predictive maintenance and interactive 3D asset view
PART THREE
Awareness Score for Portfolio Managers
-
List of Installed and needed sensors.
-
Systems will recommend sensors that need to be Installed considering factors like Domain, geographical location, weather, Occupants density, etc.
-
Helps the Portfolio Manager to do the budget planning and decision making considering the site.


.png)
PART FOUR
Mobile App For Facility Manager
-
For dashboard users and a few beta users.
-
Extra features to make video & audio calls, share reports, and resolve issues remotely. (Resolving one of the major needs identified with users during workshops)
PART FIVE
RESOLVE ISSUES FASTER
Resolve issues automatically or remotely by staying informed with all the updates from your site.

Home page indicating overall score and respective pillar score

Live update on latest service tickets
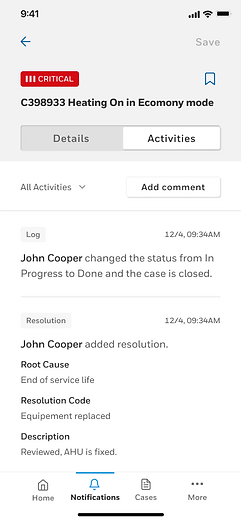
Troubleshoot issues
PERSONA
Digital Signage For Occupants
Introducing touchless technology for tenants, in which they have presented information on indoor air quality by educating them about measures taken by the authority to keep them safe inside the buildings .

DESIGN


PART FIVE
Non Interactive Digital Signage
-
The information displayed is customizable.
-
The customization is done through a configuration page by the facility Admin.
-
Everything including the layout is customizable based on the organization's needs.
BEHIND THE SCENES
Timeline


Design Thinking workshop
-
Conducted multiple virtual design thinking workshops with users and other stake holders
User Journey
-
High-level user journey for dashboard and mobile including all the personas and different touch points.

.png)

Story Board & XOs
-
High-level user journey for dashboard and mobile including all the personas and different touch points.
Wireframes
-
Multiple iterations on all the wireframes considering user feedback after testing.


User Testing
-
Feedback on all the product have been gathered regulary.
How did we do ?
After releasing the product to an average of 20-30 customers per day we gathered these interesting data considering the development constraints.
26%
Increase in the daily usage (76 users in 7 days)
87%
Score in Usability Metrics
20%
Quicker issue resolved
280
Direct Down, -14.4% (unique users)
-
Regular iteration based on user feedback.
-
Regular tracking on localytics
-
Filed a Patent
Where are we...
Before

After

bottom of page